Battery fast charging
Developers of battery powered devices are targeting shorter charging times to improve user experience and to address issues such as electric vehicle range anxiety. However, how does fast charging work, how fast can you go and what happens if you go too fast? These questions are covered in the linked video and below.
What do we mean by fast charging?
In short, this is where we deliver higher power to reduce the charging time.
To unpack this, we first have to understand some of the key metrics. The capacity of our battery, measured in Ah, represents the amount of electrical charge it can store, the nominal voltage is the average voltage of the battery over its operating range and the energy is the product of the two, given in Wh.
If we then want to estimate the charging time for a given battery, we divide the energy, in Wh, by the power, in W, to get the theoretical charging time in hours. Here, we see that charging time depends on both the characteristics of the charger and the battery.
For an example electric vehicle, this might use parallel cell strings where the capacity adds up to around 150 Ah. Here, the nominal pack voltage might be around 400 V, giving a 60 kWh battery pack.
If using a standard charger with a power of 1.5 kW this would take approximately 40 hours to fully charge.
If using a fast charger at 100 kW, this would take around 36 mins.
Note that, all of these times, assume there are no limitations and often, in reality, the charging time is longer due to limitations which we’ll discuss later.

* Actual charging time often longer due to practical limitations
Porsche Taycan
Example electric vehicle
Looking specifically at the example of the Porsche Taycan, one of the fastest charging electric vehicles, here we can see it has a 97 kWh battery pack, 800 V architecture and maximum charging power of 320 kW with a stated range of between 372 and 510 miles.
From Porsche’s website, we can see that using a 9.6 kW AC charger, would take 13 hours to charge from 0-100% state-of-charge (SOC), whereas if maximum power DC charging was used this would take only 18 minutes from 10-80%.

https://unsplash.com/photos/red-porsche-911-on-gray-asphalt-road-under-blue-and-white-sunny-cloudy-sky-Gc8HFreirYs
https://www.porsche.com/uk/models/taycan/taycan-models/taycan/ | * Range and energy efficiency depends on use conditions
AC vs DC
Now in the Porsche example, you may have noticed reference to AC and DC charging, but what do these mean?
If we first look at AC (alternating current) charging, this takes alternating current from the grid and then uses the vehicles onboard charger to convert this to direct current for the battery pack. This is usually lower power (upto around 22 kW) resulting in charging speeds of around 30 miles of range per hour of charge.
You would normally find these types of chargers at home, a workplace or long-duration parking areas like supermarkets.
For DC (direct current) charging, which is usually much faster, it uses DC power from an external power source, bypassing the vehicles onboard charger, to directly charge the battery. Power can reach upto 350 kW, though higher power systems have been trialled. This can give upto 800 miles of range per hour of charge.
You’ll generally find these systems at fast charging stations.

What happens what we charge a battery?
If we now look inside the battery we can see that a cylindrical cell has a structure similar to a Swiss roll.
Here, we have multiple layers which make a unit cell. Firstly, we have a layer of copper which provides an electrical pathway, then we have a porous anode, typically made of graphite and a porous polymer separator which prevents the anode and cathode from touching. We then have a porous cathode, usually made of a transition metal oxide, which is connected to an aluminium cathode current collector and finally a liquid electrolyte fills in the void space.
When the battery is fully discharged, all the lithium-ions are in the cathode.
When we charge the battery, the lithium-ions move from the cathode to the anode via the electrolyte. The electrons can’t go through the separator or electrolyte and therefore have to pass through an external circuit where they recombine with the lithium-ion at the anode. This reaction reverses when we discharge the battery.


What limits the speed of fast charging?
Whilst we can easily estimate the theoretical charging time, in practice there are a number of factors which limit the actual charging time which includes:
Maximum power of the charger
Voltage limits
Temperature limits
Lithium plating
Combined, these effects mean the actual charging speed is often lower than the theoretical speed.

Voltage limits
So earlier we saw that the actual charging speed of a battery is often lower than it’s theoretical value. One of the reasons for this is that we need to keep a battery within it’s upper and lower voltage limits to avoid damaging the cell. This is often 4.2 V-2.7 V, but depends on the chemistry.
When charging, if we go over 4.2 V this can cause side reactions such as the decomposition of the electrolyte which can cause the generation of flammable gases and accelerated degradation of the cell.
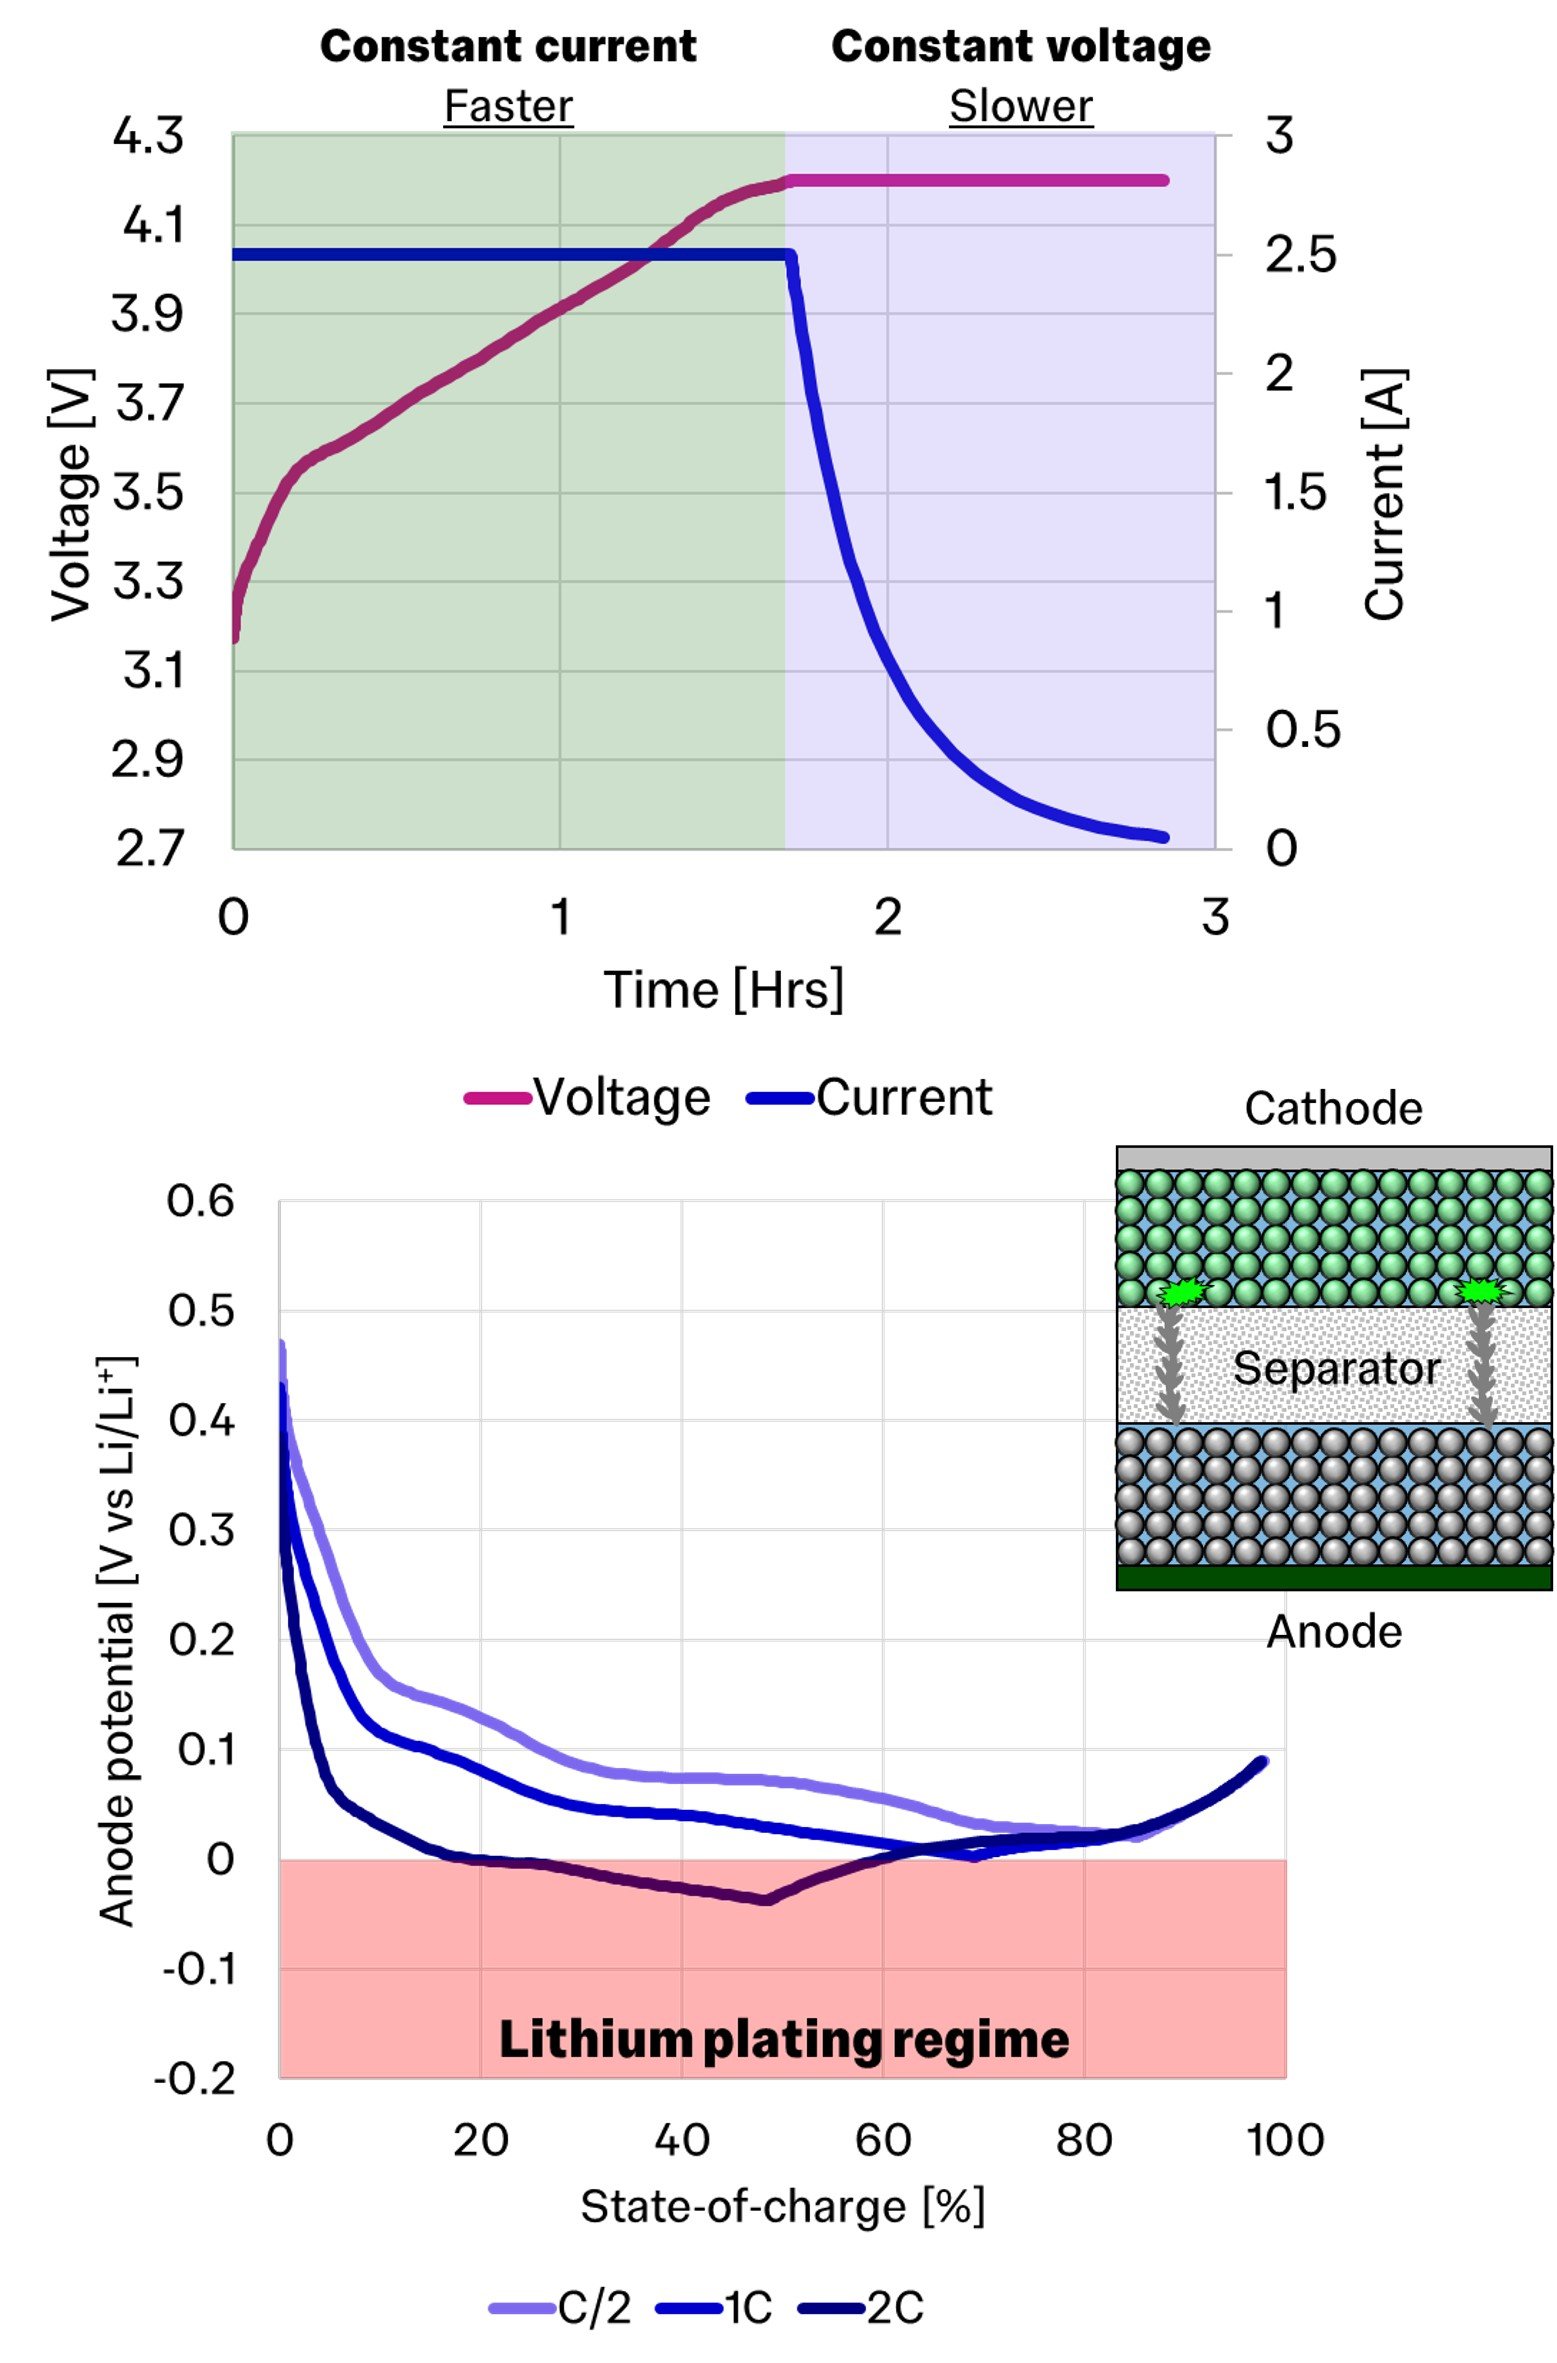
Therefore, one of the most common charging protocols is the constant current-constant voltage profile, or CC-CV.
In this 0.5 C example, the theoretical time to full charge is 2 hours, however in reality it takes 2.8 hours. This is because as we apply the constant current to the battery, the voltage increases, but when it hits 4.2 V, we have to decrease the current to avoid pushing the voltage too high.
The magnitude and duration of this CV phase is often linked to how fast the lithium-ions can move in the electrode materials.
Thus, we have 2 parts of the charging protocol; a faster constant current portion, and a slower constant voltage portion, where the current is decreased to avoid side reactions such as the decomposition of the liquid electrolyte.


* Depends on chemistry | SEI = Solid Electrolyte Interphase, NMC = Lithium Nickel Manganese Cobalt Oxide
Charging data generated using PyBaMM
More current = faster charging
Upto a limit
If we want to increase the speed of the charging, the most common approach is simply to increase the current. Here, the term C-rate, is a measure of the rate at which a battery is charged or discharged relative to its maximum capacity. We calculate this as the ratio of the applied current to the capacity, with the inverse of this giving the charging time in hours.
Returning to our 0.5 C example, which is 2.5 A for our 5 Ah cell, we see that the theoretical charging time is 2 hrs and the actual time to 100% is 2.8 hrs. Now because our charging speed drops significantly towards the end of charge, the time to 80% is often quoted instead.
When we increase the C-rate to 1C, the theoretical charge time to 100% is 1 hr, but in reality the full charge time only drops to 2.1 hrs, or 0.8 hrs to 80%.
As we increase the C-rate further to 2C, which should give a 30 min charge time, the actual 100% charge time only drops to 1.8 hrs or 30 mins to 80%. This diminishing return, when increasing the current, is due to hitting the 4.2 V limit, after which the charging current is reduced.

Charging data generated using PyBaMM
Charge times assume the battery is initially at 0% SOC
Avoiding thermal runaway
Beyond voltage limits we also have temperature limits, which are particularly important if thermal runaway and fire is to be avoided.
If we return to our schematic of a battery, one important detail is something called the solid electrolyte interphase (SEI). When we have lithiated graphite, this is unstable with most battery electrolytes and starts reacting. Luckily, whilst there are some initial reactions between the lithiated graphite and the electrolyte, this then semi-passivates the surface to protect it from further reactions.
However, if the temperature of the battery goes over ~70°C a series a reactions start which can lead to thermal runaway:
@ ~70°C - The SEI starts to decompose; generating heat as the lithiated graphite reacts with the electrolyte
@ ~130 °C - The polymer separator melts, causing a short circuit between the anode and cathode, which releases further heat
@ ~200°C - The liquid electrolyte starts to decompose, releasing toxic chemicals such as hydrofluoric acid
@ ~300°C - The cathode then decomposes, leading to oxygen release, which can make extinguishing a fire extremely difficult
We therefore want to avoid thermal runaway at all costs.

Temperature values vary depending on specific chemistry but are broadly representative
Adapted from Progress of enhancing the safety of lithium ion battery from the electrolyte aspect. Wang et al. Nano Energy 2018; 55 :93–114 .
Check out the page on battery safety of more details.
More current = more heat
Returning to the battery behaviour during charging. As we add more current to the battery, naturally the cell will heat up faster and thus we need to be able to monitor this.
Here, you can see that as we increase the C-rate from C/2 to 3C the maximum current obviously increases, with the temperature profile also increasing. As we get to the 3C charging rate, we can see that we approach a dangerous temperature which, if not managed, can result in thermal runaway.
Of course, this temperature can be managed (to a certain degree) with the use of a thermal management system, which removes move heat from the battery, but there are limits to how effective this can be.

Lithium plating in action
Seeing is believing
Finally, if cell voltage and temperature aren’t limiting factors, the other main barrier to fast charging is lithium plating. In the ideal charging process, lithium-ions, from the cathode, are intercalated into the anode, however if this is done too quickly, instead of intercalating, the lithium-ions can form metallic lithium on the surface of the graphite. This is bad for a number of reasons. Firstly, this metallic lithium is highly reactive to the electrolyte, and secondly it can form dendrites or needles of lithium which can short-circuit the battery and lead to failure. In this great video from Dr. Xuekun Lu et al., we can see a graphite electrode being lithiated. This starts from the left side where we have the separator and as graphite lithiates, the colour changes from grey to golden.
As this continues, we get to a point where metallic lithium forms and if this pierces the separator can cause a short circuit or at the very least form additional SEI, resulting in degradation.

Multiscale dynamics of charging and plating in graphite electrodes coupling operando microscopy and phase-field modelling. Lu et al. Nature Communications. 2023
What is the voltage you measure?
To understand when lithium plating occurs, we first need to revisit the voltage you measure on a battery.
Here, you can see the typical voltage of a single lithium-ion battery from 0% (2.7 V) to 100% (4.2 V).
This voltage made up of 2 components, the anode of our battery which is typically graphite and the cathode which is often a transition metal oxide. Here the overall cell voltage is the difference between the cathode and the anode potentials.
When the battery is at 0% SOC, the lithium-ions are in mostly in the cathode, with the cathode potential at its lowest and the anode potential at its highest, giving a low overall voltage.
When the battery is charged, the lithium-ions move to the anode and when doing this, causes the cathode potential to increase and the anode potential to decrease, giving a high overall cell voltage.
This forms the basis of our understanding, but these voltages and potentials are shown for extremely low C-rates, which for this case is C/100 or what we will call our pseudo-open circuit potentials (p-OCP).

What happens when we go too fast?
The importance of anode potential in lithium plating
Now if we focus on the anode, which is where we have the lithium-ions moving towards, we can see what happens when we start increasing the current from our slow C/100 charge.
At C/2, or a 2 hour theoretical charge, we can see that as we increase current, the anode potential drops for the same SOC due to resistances in the cell. Increasing this further to 1C further decreases the dynamic anode potential.
However, once we apply a 2C load, at approximately 20% state-of-charge, the anode potential goes below 0 V vs Li/Li+, which is the region where lithium plating can thermodynamically occur. The further negative we are, the faster this rate of lithium-plating occurs as opposed to the ideal lithium-ion intercalation into graphite.
Thus, the key to avoiding lithium-plating, and therefore long lifetime, is to avoid the anode potential going negative.

Boost charging
Now that we understand that lithium plating occurs when the anode potential goes negative (vs Li/Li+) we can then revisit ways to improve the charging speed.
If we look at a typical 1C CC-CV charging profile we can see from the anode potential at a low SOC, or at the start of charging, that we are not close to the plating region meaning that we could potentially apply more current in this period with minimal risk of lithium plating.
This is where the idea of a charging profile called boost charging comes in, whereby we apply a higher current at the beginning of charge, but then reduce this before the anode potential goes negative. By doing this we put more charge into the battery when we are further away from the lithium plating region.
In this example, we go from taking 50 mins to charge to 80% for the CC-CV profile, to 45 mins with the boost charging profile which is a 10% reduction in charge time without any additional lithium plating, in theory.
Note that this is just one simple example but other variations exist with greater benefits which have been optimised for a specific battery, however it should also be noted that the anode potential can also be influenced by factors such as temperature, where generally low temperature charging runs a higher risk of lithium plating.

Fast charging protocols
Beyond constant current
Beyond CC-CV and boost charging there are also a number of other charging profiles which people are currently investigating.
These include pulse charging where we pulse the charging current as opposed to having a constant current load. Here results have suggests that this can reduce battery impedance and reduce the effects of some of the degradation mechanisms.
Beyond that, another approach is anode potential control, whereby we use a model to estimate the anode potential of a cell when charging, and then use this model to maximise the charging current whilst avoiding the lithium plating regime. The challenge here is having a model which can estimate the anode potential accurately over the lifetime of the cell.
Beyond these, there are many other profiles which people are currently researching but have not been covered here.

Summary
So, to summarise. Fast charging lithium-ion batteries is where we deliver higher power to reduce charging time.
Commercially, for electric vehicles, we have AC charging which is generally slower and can take >24 hours to fully charge a vehicle, but this depends on the exact charger and size of battery.
Faster DC charging is now being rolled out which bypasses an electric vehicle’s on-board charger to apply hundreds of kW of power which can charge a battery in less than 20 mins.
However, in reality we have a number of factors which limit the speed of charging which includes keeping the voltage of the battery within safe limits. This is often 4.2 V maximum in many high energy dense batteries which is imposed to avoid side reactions such as electrolyte decomposition which can accelerate degradation and even cause catastrophic failure.
Beyond that, we also need to keep the temperature of the battery within safe operating regions which typically is no higher than around 70°C. If you exceed this, then the protective SEI layer can decompose leading to thermal runaway.
Finally, if we go too fast then instead of intercalating the lithium-ions into the graphite this can instead plate on surface of the graphite which leads to accelerated degradation but also potential formation of dendrites which can pierce the battery separator and cause a short-circuit, again potentially causing catastrophic failure.
With this understanding, many are now developing smarter fast charging algorithms such as the boost charging example where we put extra current into the battery at the beginning of charging when we are at a lower risk of lithium plating, or other methods such as pulse charging and anode potential control which have also been shown to have benefits.